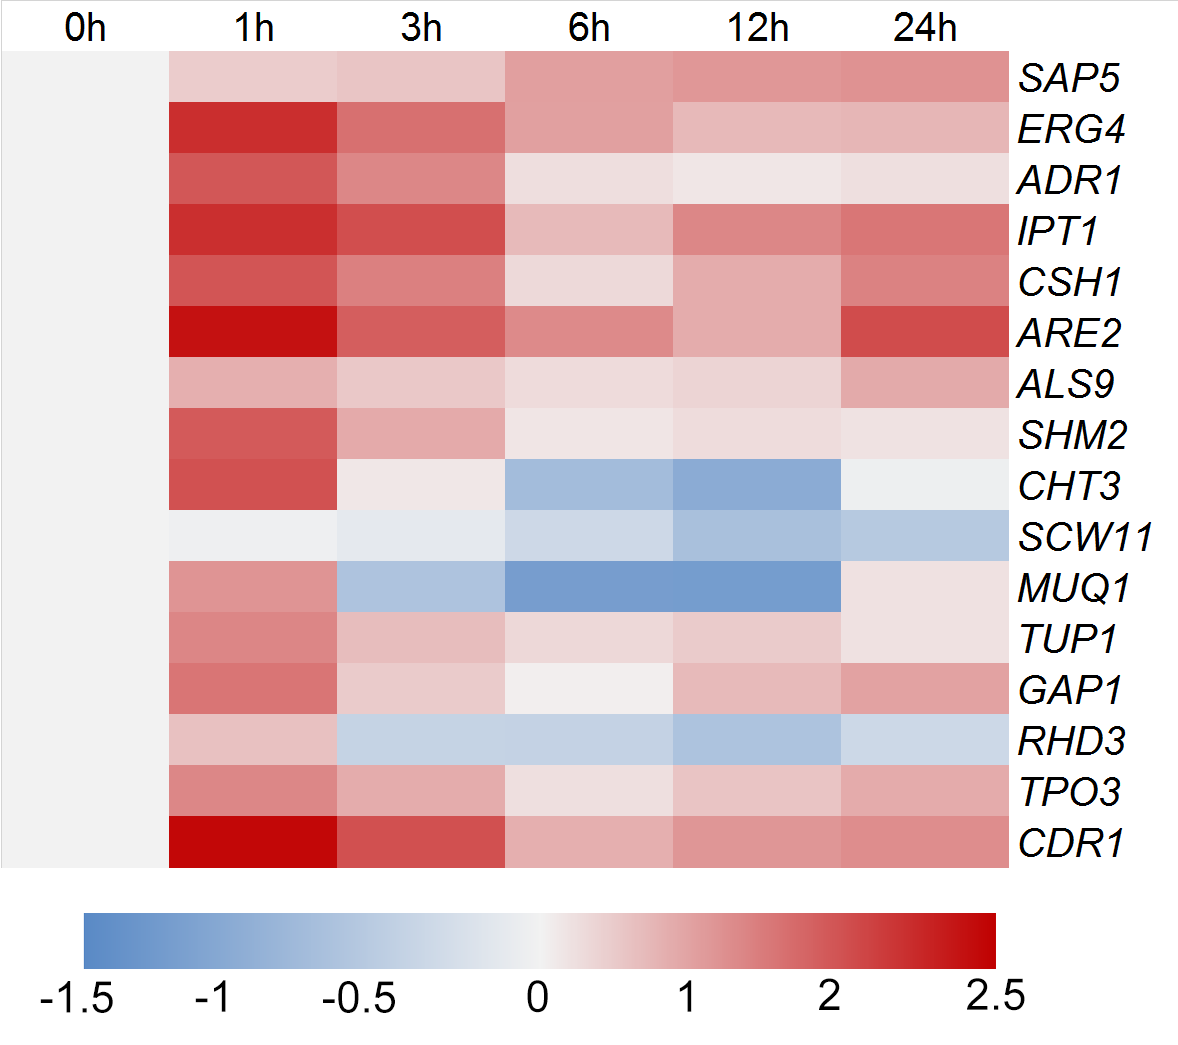
Heat map of genes detected by quantitative reverse transcription PCR (RT-qPCR). The heat map illustrates that the 15 selected deferentially expressed genes were in accordance with the results of gene chip and differential gene expression tendency analyses. The rows represent genes and the columns represent replicates of each time points. Blue indicates downregulation, red upregulation, and white indicates the gene expression of Candida albicans before infection.
Heat map of genes detected by quantitative reverse transcription PCR (RT-qPCR). The heat map illustrates that the 15 selected deferentially expressed genes were in accordance with the results of gene chip and differential gene expression tendency analyses. The rows represent genes and the columns represent replicates of each time points. Blue indicates downregulation, red upregulation, and white indicates the gene expression of Candida albicans before infection.
Leave a Reply