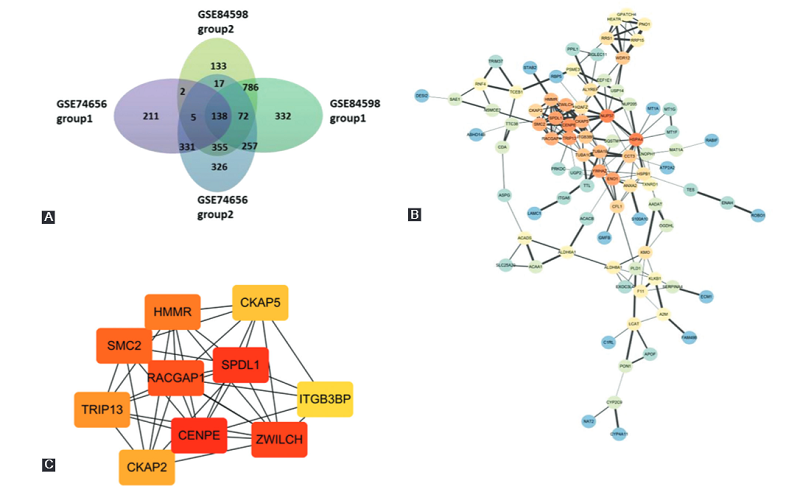
Differentially expressed genes (DEGs) identified in GSE74656 and GSE84598. (A) Venn diagram of the overlapping DEGs between GSE74656 and GSE84598. (B) Protein-protein interactions network of 138 SDEGs. Orange nodes have the high-est degree while blue nodes have the lowest degree. The smaller the edge, the lower the combined score. (C) The top 10 hub genes screened using the Cytohubbo module in Cytoscape. Darker node color indicates a higher score.
Untitled
Differentially expressed genes (DEGs) identified in GSE74656 and GSE84598. (A) Venn diagram of the overlapping DEGs between GSE74656 and GSE84598. (B) Protein-protein interactions network of 138 SDEGs. Orange nodes have the high-est degree while blue nodes have the lowest degree. The smaller the edge, the lower the combined score. (C) The top 10 hub genes screened using the Cytohubbo module in Cytoscape. Darker node color indicates a higher score.
Leave a Reply