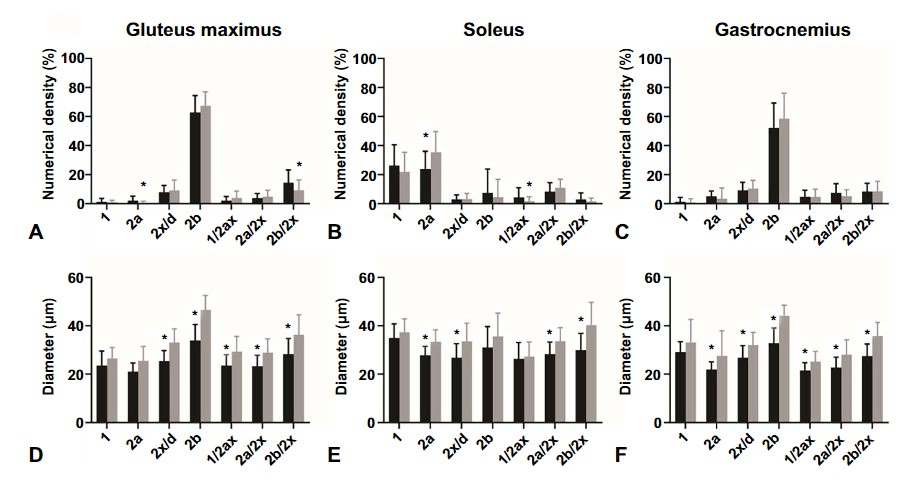
Figure1. Numerical density and diameter of (A,D) gluteus maximus,(B,E) soleus, and (C,F) gastrocnemius muscle fibers. Comparison between type 1 diabetes mellitus mice (black columns; n=12) and non-diabetic mice (gray columns; n=12). Data are presented as mean±standard deviation. *P<0.05.
Leave a Reply